Title and Subtitle
In this section, we will get an understanding of how we can provide a title and a subtitle to the canvas.
Add title and subtitle
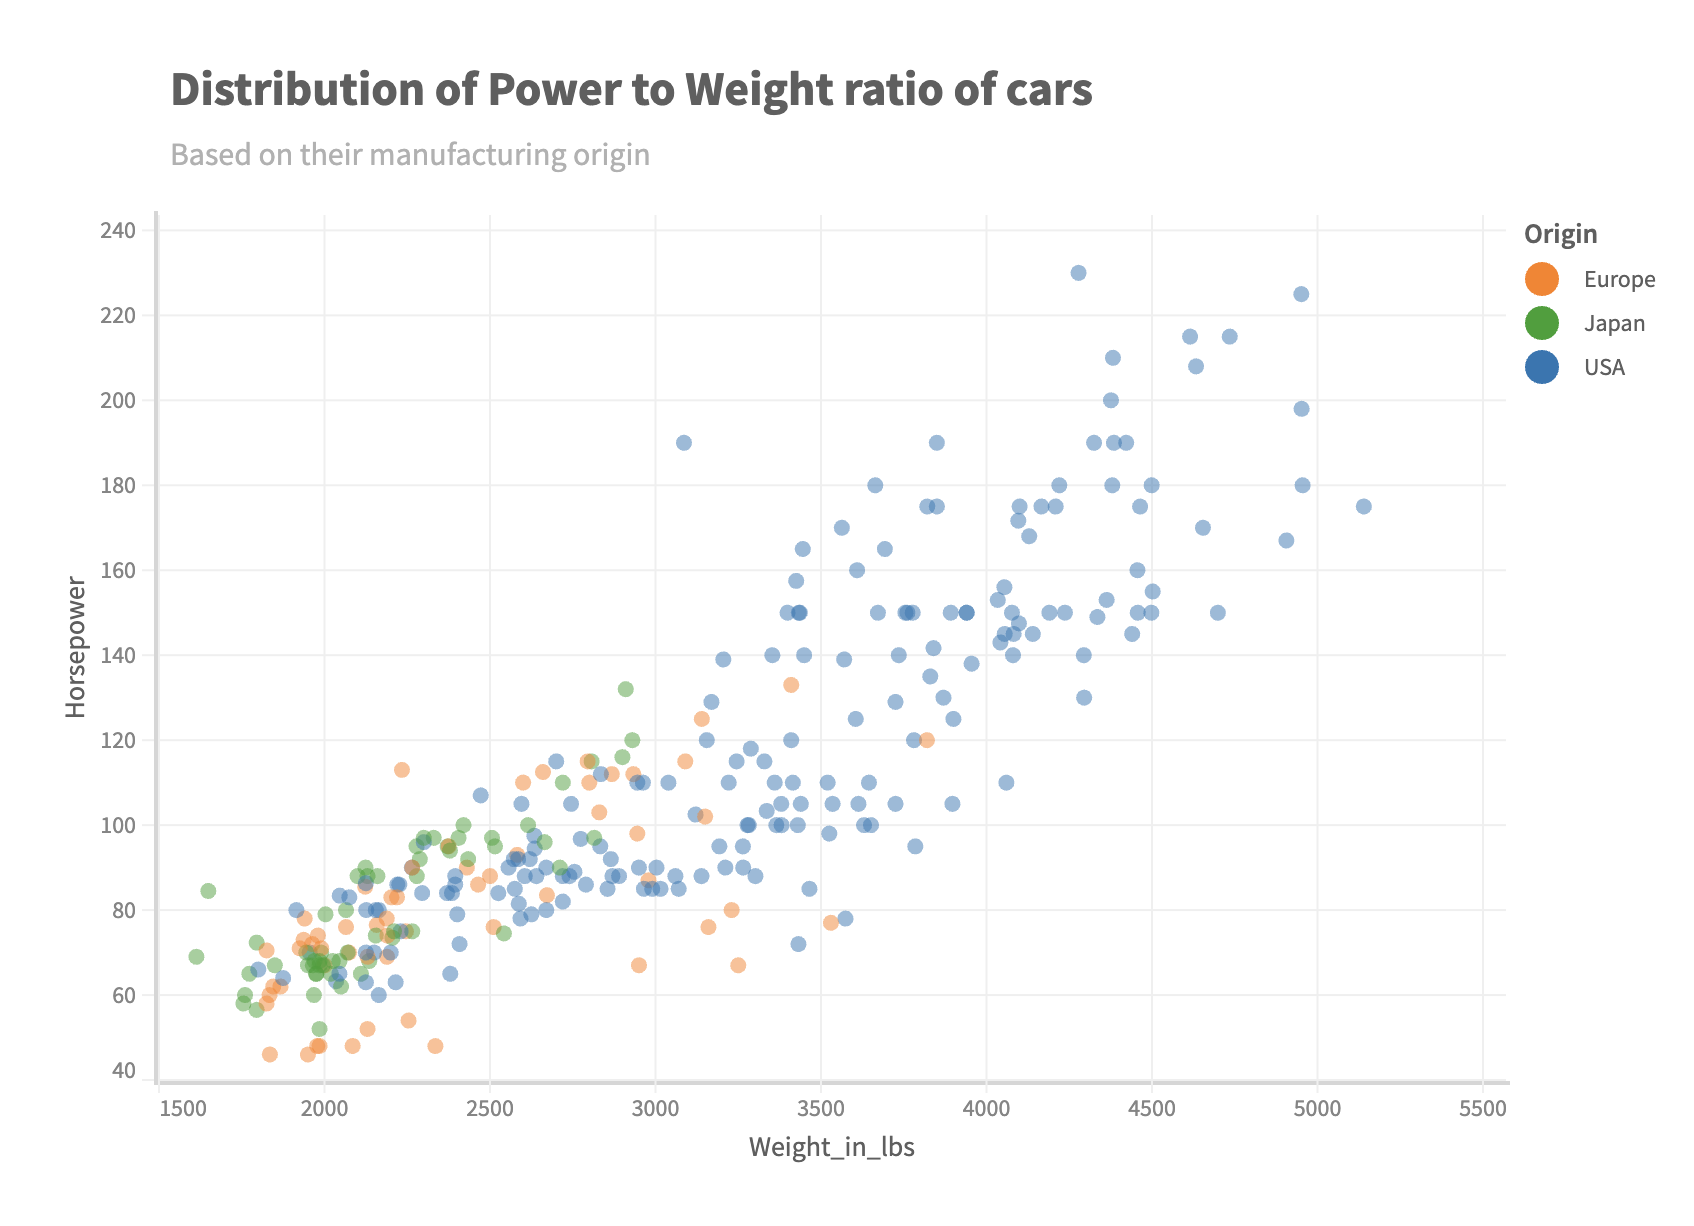
You can add a title to the chart by using the title method on canvas. Similarly, to add a subtitle, you can use the subtitle method on canvas. Both the title and the subtitle methods accept parameters in the same way.
Adding simple text content
You can either add plain text to the title/subtitle or you can use the html operator of Muze to create your custom html markup as the title/subtitle. Let us see how to add them to our canvas.
 muze.canvas
  .title('Distribution of Power to Weight ratio of cars')
  .subtitle('Based on their manufacturing origin')
const { muze, getDataFromSearchQuery, env } = viz;
const data = getDataFromSearchQuery();

muze
  .canvas()
  .data(data)
  .rows(["Horsepower"])
  .columns(["Weight_in_lbs"])
  .color("Origin")
  .detail(["Name"])
  .title("Distribution of Power to Weight ratio of cars")
  .subtitle("Based on their manufacturing origin")
  .mount("#chart");
Format title and subtitle using html operator
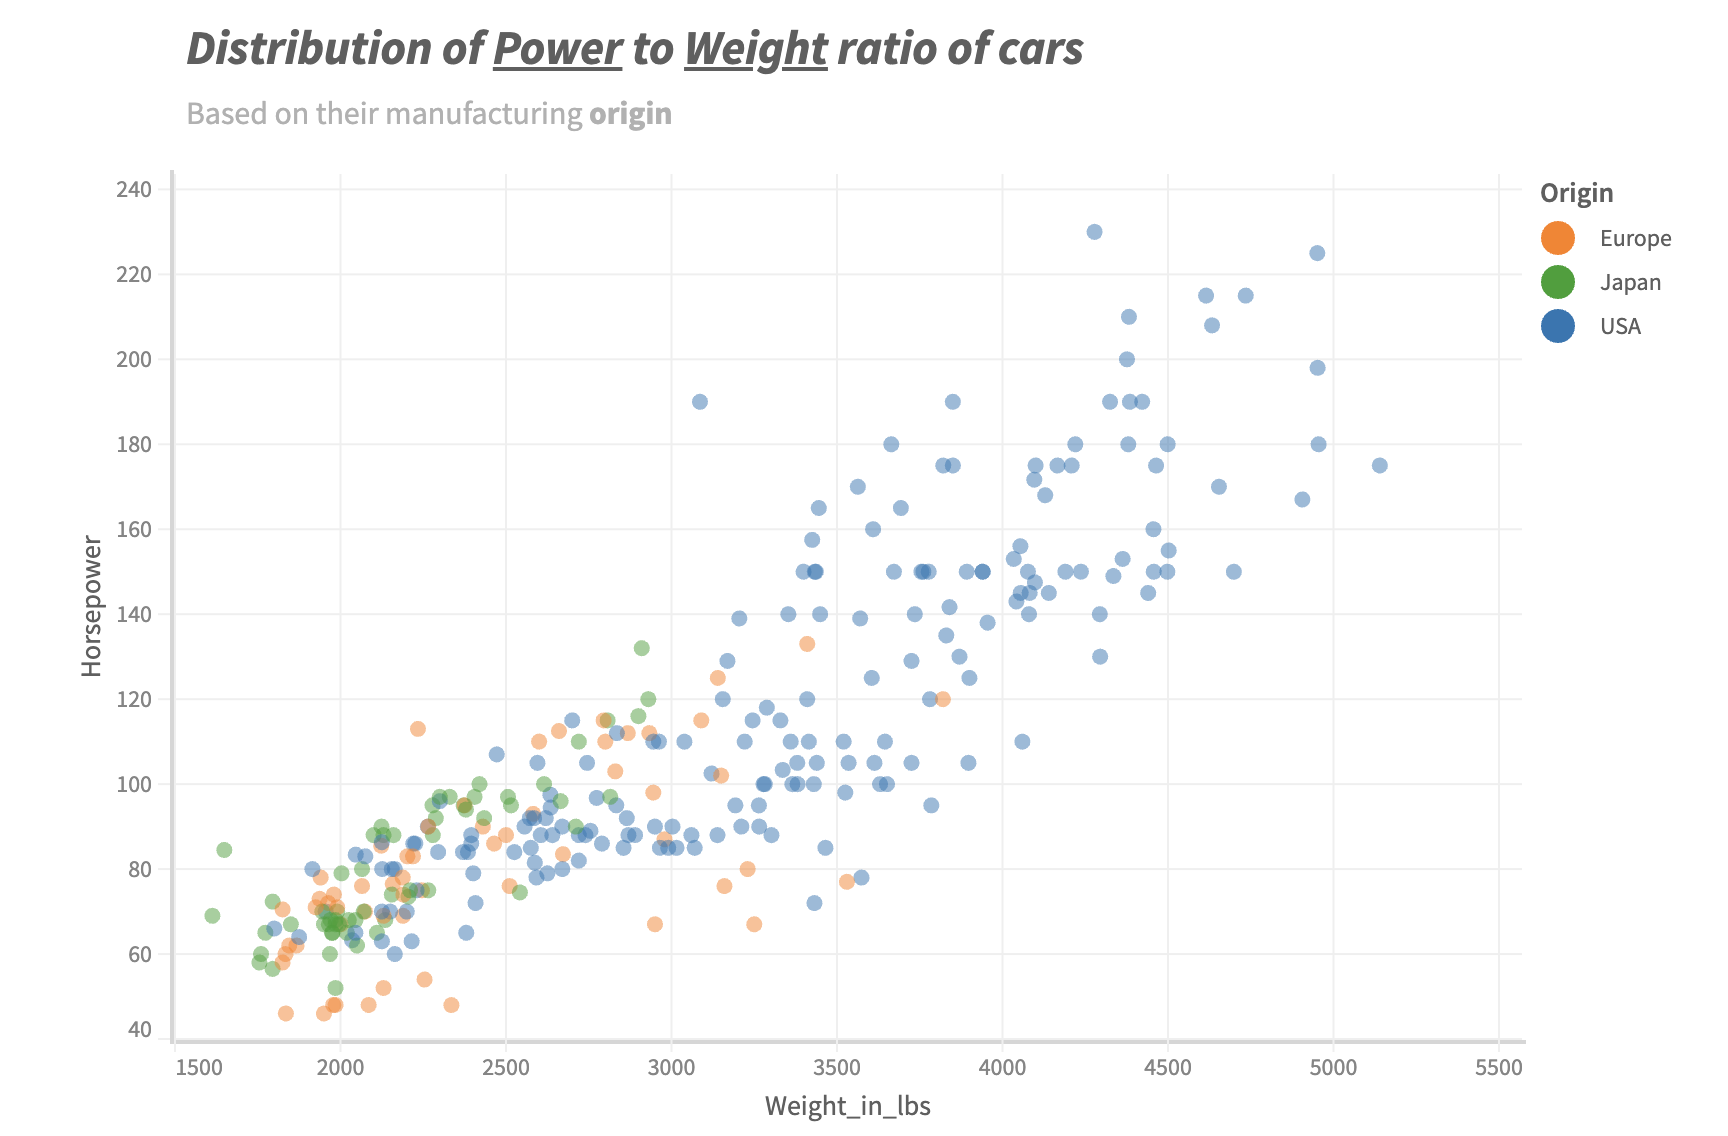
We can also add our own custom html component to Muze instead of plain text by using the the html operator. The html operator accepts content with inline html tags in string format which gets converted into DOM tree in a safe way which Muze internally then renders.
For example, we can take the last example and change the title into an italic text using the html operator:
const { muze, getDataFromSearchQuery, env } = viz;
const data = getDataFromSearchQuery();

const html = muze.Operators.html;

muze
  .canvas()
  .data(data)
  .rows(["Horsepower"])
  .columns(["Weight_in_lbs"])
  .color("Origin")
  .detail(["Name"])
  .title(
    html`<i
      >Distribution of <u>Power</u> to <u>Weight</u> ratio of cars<i></i
    ></i>`,
  )
  .subtitle("Based on their manufacturing <b>origin</b>")
  .mount("#chart");
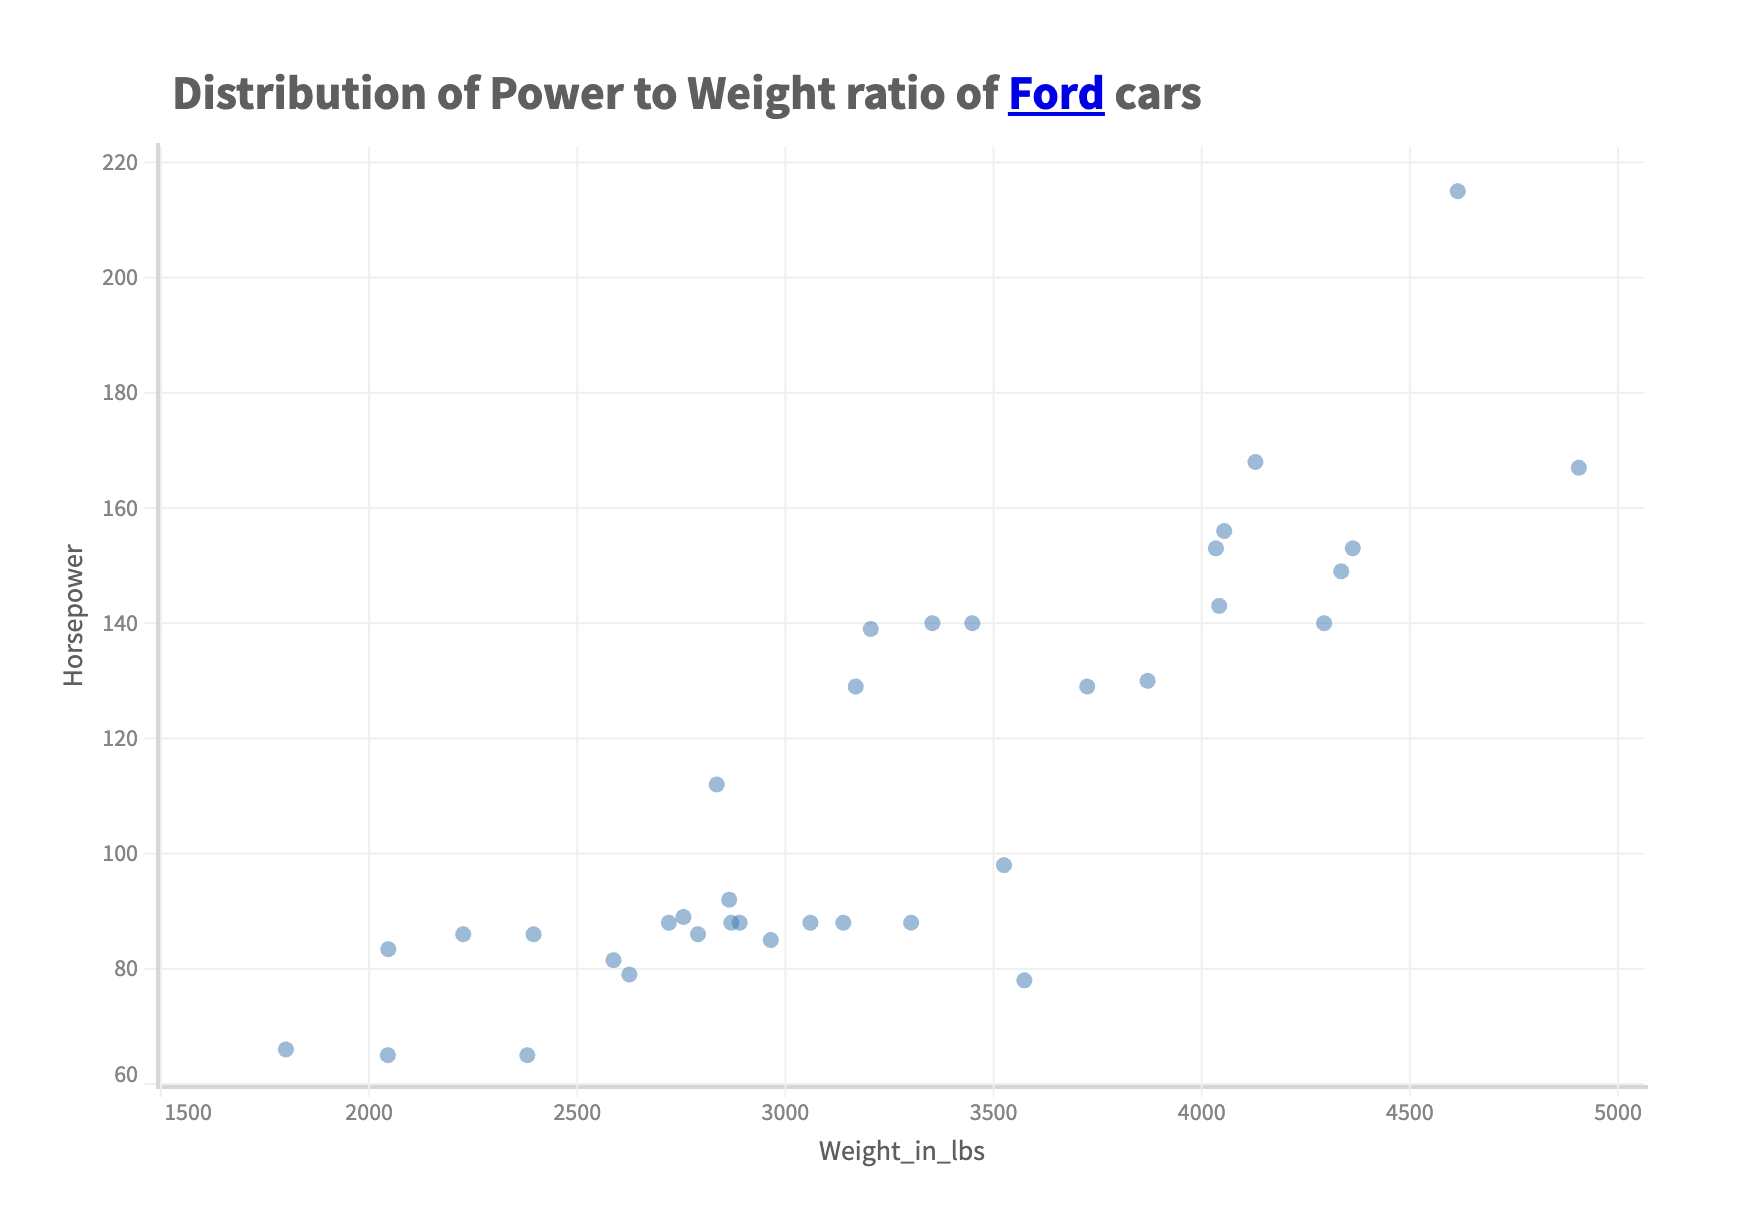
You can also add links in your title content using html operator:
canvas.title(
  html`<span
    >Distribution of Power to Weight ratio of
    <a href="https://en.wikipedia.org/wiki/Ford_Motor_Company">Ford</a>
    cars<span></span
  ></span>`,
);
Example
const { muze, getDataFromSearchQuery, env } = viz;
const data = getDataFromSearchQuery();

const html = muze.Operators.html;

muze
  .canvas()
  .data(
    data.select({
      field: "Maker",
      value: "ford",
      operator: "eq",
    }),
  )
  .rows(["Horsepower"])
  .columns(["Weight_in_lbs"])
  .detail(["Name"])
  .title(
    html`<span
      >Distribution of Power to Weight ratio of
      <a href="https://en.wikipedia.org/wiki/Ford_Motor_Company">Ford</a>
      cars<span></span
    ></span>`,
  )
  .mount("#chart");
Positioning and aligning the title and subtitle
In addition to altering text for the title and subtitle, we can change their position and alignment configurations by supplying the required configuration in the second argument of the title or subtitle methods. These configurations are applicable independently to both the title and the subtitle.
- position: TOP or BOTTOM (default TOP)
- align: LEFT, RIGHT or CENTER (default LEFT)
By default the title and subtitle are drawn on the top left of the canvas. By specifying the position, we can change the way they appear.
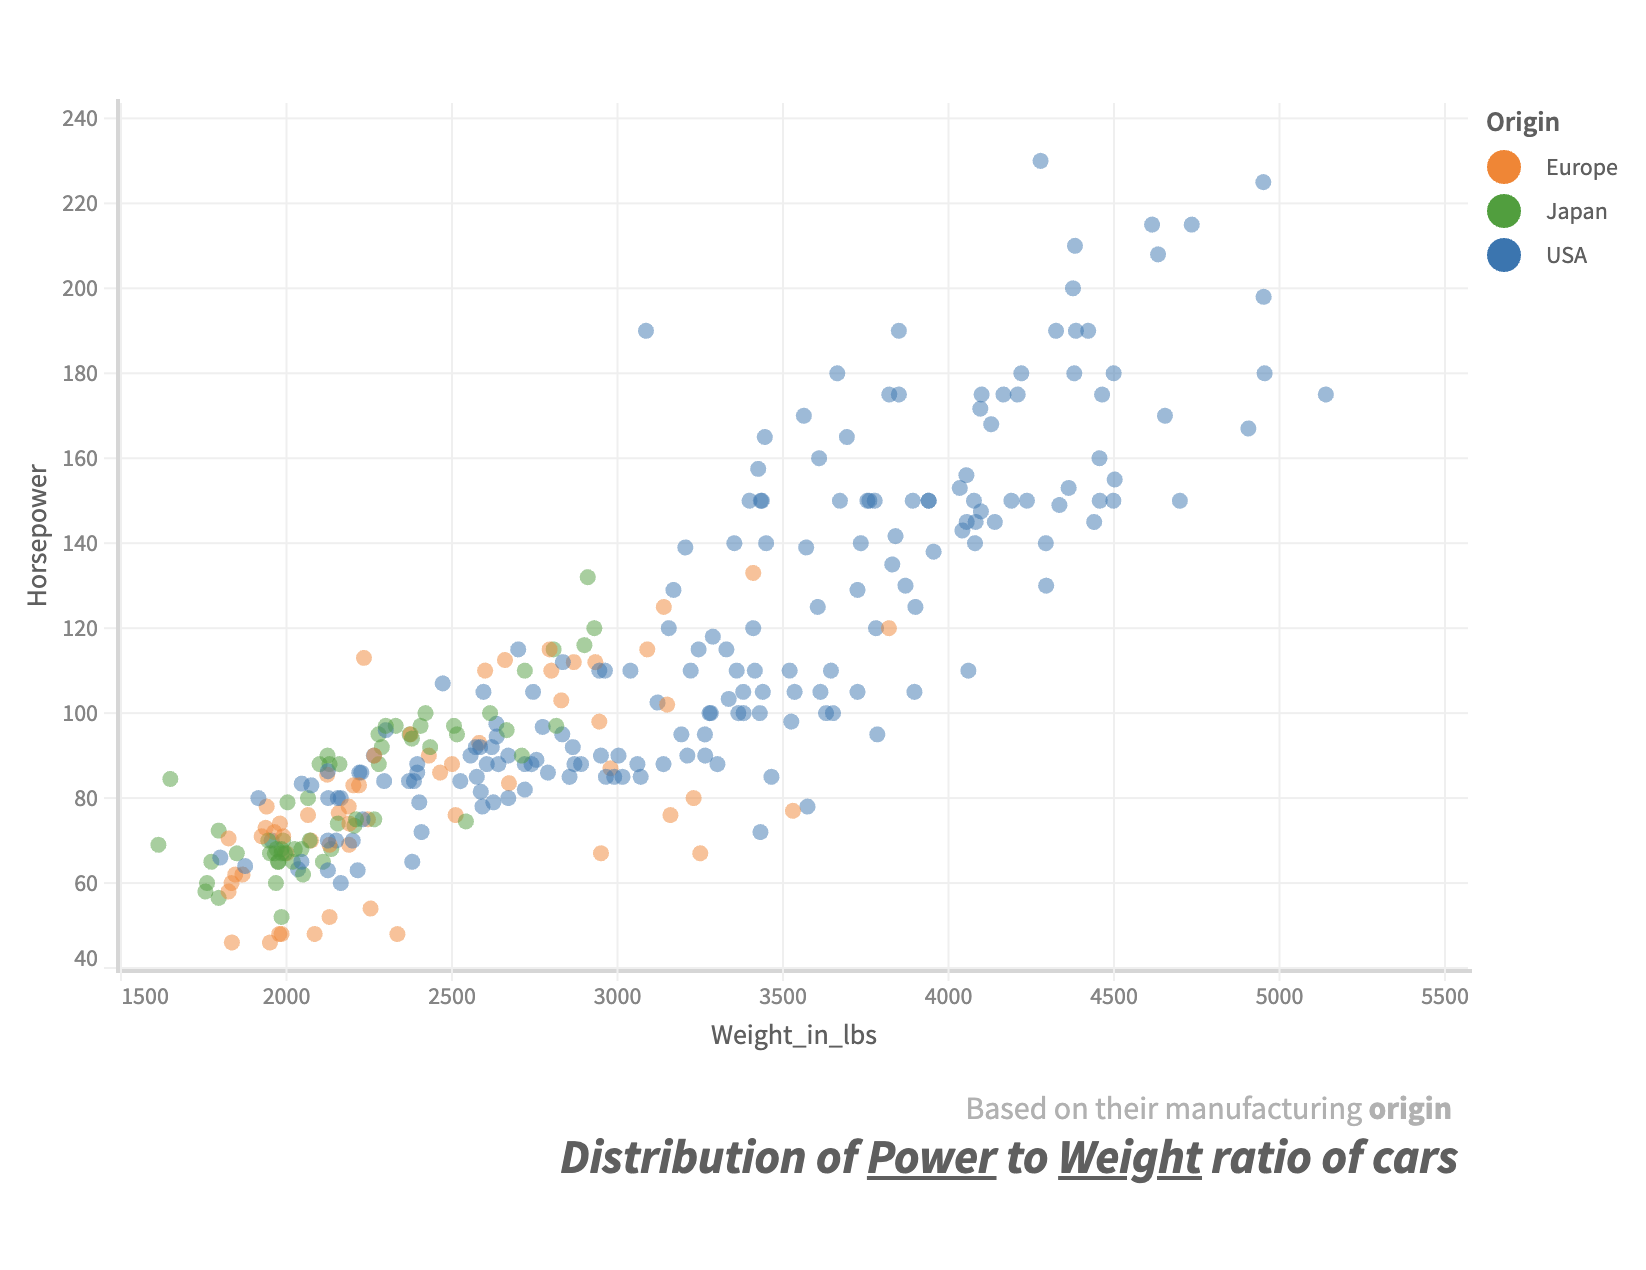
For example, if we want to change the position of the subtitle to the bottom right of the canvas, we can provide the following configuration:
const { muze, getDataFromSearchQuery, env } = viz;
const data = getDataFromSearchQuery();

const html = muze.Operators.html;

muze
  .canvas()
  .data(data)
  .rows(["Horsepower"])
  .columns(["Weight_in_lbs"])
  .color("Origin")
  .detail(["Name"])
  .title(
    html`<i
      >Distribution of <u>Power</u> to <u>Weight</u> ratio of cars<i></i
    ></i>`,
    {
      position: "bottom",
      align: "right",
    },
  )
  .subtitle("Based on their manufacturing <b>origin</b>", {
    position: "bottom",
    align: "right",
  })
  .mount("#chart");